|
|
Notes:
Be-10 calibration data from:
Heyman, J., 2014. Paleoglaciation of the Tibetan Plateau and surrounding mountains based on exposure ages and ELA depression estimates.
Reference production rates and fit values are computed using this page and this calibration data set excerpted from the supplemental data table in the paper. This differs from the calculations in the paper in that all samples are weighted equally according to their uncertainties, rather than all sites being weighted equally. However, this method ensures that exactly the same code is used for both production rate and exposure age calculations. Note, however, that the results of both methods are indistinguishable.
Heyman did not compile Al-26 concentrations. Thus, reference production rates for Al-26 in the table below are calculated from those for Be-10 using (P26 / P10) = 6.75.
|
|
Trace information from calibration code:
Calibration data set name: Heyman 2014
Computation time: 258.17 sec
Calibration wrapper version: 2.2-cal-dev
Objective function version: 2.2-dev
Age calculation version: 2.1
Muon calculation version: 1.1
Constants version: 2.2.1
|
|
| Scaling scheme |
Reference Be-10 |
Percentage |
Reduced |
Reference Al-26 |
| for spallation |
production rate (atoms/g/yr) |
uncertainty |
chi-squared |
production rate (atoms/g/yr) |
|
| St | 3.92 | +/- | 0.14 | 3.7 | 1.77 | 26.46 | +/- | 0.97 | | De | 3.82 | +/- | 0.14 | 3.6 | 11.04 | 25.74 | +/- | 0.93 | | Du | 3.84 | +/- | 0.14 | 3.6 | 9.79 | 25.89 | +/- | 0.94 | | Li | 4.12 | +/- | 0.15 | 3.6 | 8.60 | 27.82 | +/- | 1.01 | | Lm | 3.86 | +/- | 0.14 | 3.7 | 2.13 | 26.07 | +/- | 0.95 |
|
|
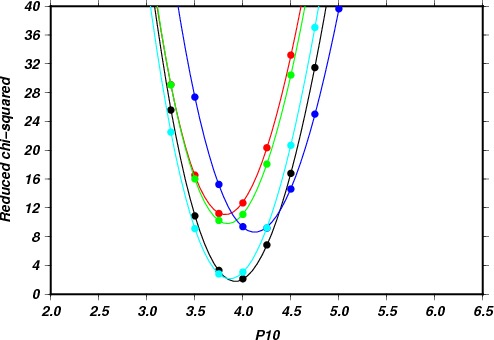
Scaling scheme fits to calibration data: This plot shows the fit
between each scaling scheme and the calibration data. The filled circles are calculated
reduced chi-squared values for evenly spaced trial values of the reference Be-10 production rate. The corresponding
lines are the polynomial interpolations used to determine the value that minimizes the fit parameter.
Colors: black, St; red, De; green, Du; blue, Li; cyan, Lm. If the lines don't go through the corresponding
colored data points, or if they don't look more or less parabolic, there is
likely a problem with the fit algorithm.
|
|
|
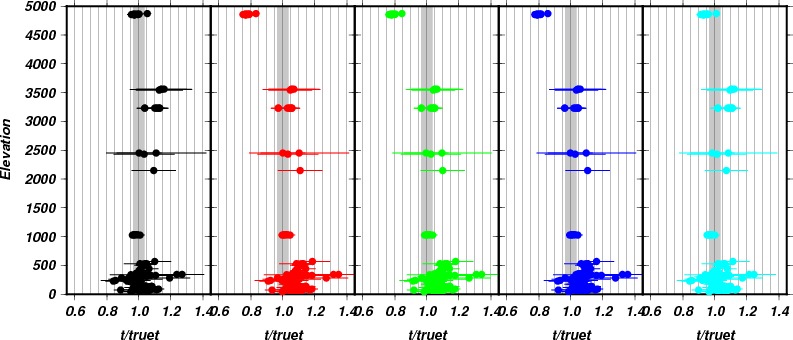
Same thing, different presentation:This plot shows ratios of exposure ages for
the calibration calculated using the best-fitting reference production rate (t) to the actual
independently determined ages of the sites (truet). Color coding for scaling schemes as above.
The gray band represents the 1-std-err uncertainty in the best-fitting reference production
rate. There is no particular significance to elevation as the independent variable other than
that it usually spreads out the data nicely.
|
|
|
|
Sample data entry:
|
|
Enter data block here.
Note change in Version 2.2:
Production rates and decay constants have been updated in this version
to reflect the Be-10 restandardization and half-life revision
in Nishiizumi et al., 2007. Thus, you must now specify the standard to
which your Be-10 and Al-26 measurements have been normalized. This means
that two input fields, the Be-10 and Al-26 standard names, have been
added. You'll need to add two columns to your spreadsheets before
cutting and
pasting data. Refer to the new example spreadsheet here. For a list of currently available standards, see this page.
|
|
|
|
|
|
|
This website is supported by the
National Science Foundation
via the CRONUS-Earth project
|
|